Summary and Schedule
This is the website for Part I of the Multi-dimensional Biodiversity Data Workshop, first offered Summer 2023.
Open to Collaborate

Suggested schedule
Day 1
| Time | Topic |
|---|---|
| 9-9:45 | Introductions, setup, workshop overview |
| 9:45-10:45 | CARE principles |
| 10:45-11:00 | Coffee Break |
| 11:00-12:30 | Abundance |
| 12:30-1:30 | Lunch Break |
| 1:30-2:45 | Abundance |
| 2:45-3:00 | Coffee Break |
| 3:00-4:30 | Traits |
Day 2
| Time | Topic |
|---|---|
| 9-10:30 | Phylogenetics |
| 10:30-10:45 | Coffee break |
| 10:45-12:30 | Population genetics |
| 12:30-1:30 | Lunch Break |
| 1:30-2:30 | Finding multi-dimensional data |
| 2:30-2:45 | Coffee Break |
| 2:45-4:00 | CARE principles in data archiving |
| 4:00-4:30 | Wrap-up and mid-workshop survey |
| Setup Instructions | Download files required for the lesson | |
| Duration: 00h 00m | 1. Introduction |
|
| Duration: 00h 30m | 2. Indigenous Data Sovereignty and the CARE Principles |
What is Indigenous data sovereignty? What are the CARE principles? What is Local Contexts Hub, and how can we use it to implement the CARE principles in our work? ::: |
| Duration: 00h 42m | 3. Abundance Data |
What is abundance data, and how can we use it to gain insights about a
system? How do I clean and manipulate abundance data to prepare for analyses? How do I calculate summary statistics and relate these to ecological pattern? |
| Duration: 00h 54m | 4. Trait data |
What information is captured via trait data? How do you read, clean, and visualize trait data? What do Hill numbers convey in the context of trait data? |
| Duration: 01h 06m | 5. Summarizing phylogenetic data |
What biological information is stored in phylogenetic Hill
numbers? How do you import and manipulate phylogeny data in R? What are the common phylogeny data formats? How do you visualize phylogenies in R? How do you calculate Hill numbers with phylogenetic data? ::: |
| Duration: 01h 18m | 6. Working with population genetic data |
What is genetic diversity? What does genetic diversity say about community assembly? What are common summaries of genetic diversity within species and communities? What are common sequence file formats? How do you read in and manipulate sequence data? How do you visualize and summarize sequence data? |
| Duration: 01h 30m | 7. Finding multi-dimensional biodiversity data |
Where do multi-dimensional biodiversity data live online? How can we use R APIs to quickly and reproducibly retrieve data? What about data that’s not in a database? ::: |
| Duration: 01h 42m | 8. CARE Principles and Data Repositories |
|
| Duration: 02h 12m | Finish |
The actual schedule may vary slightly depending on the topics and exercises chosen by the instructor.
Learner expectations
We expect learners to have some familiarity with R, including a few basic concepts:
- what a function is and how to assign output of a function to an
object, e.g.
object <- function(x) - read in tabular data, e.g.
read.csv()for comma-separated values files - bracket indexing, e.g. understanding that
data[,3]returns the third column of thedatadataframe. - install and load packages, e.g.
install.packages()andlibrary()
If you need a bit of catching up, no worries! The Software Data Carpentries has a nice Introduction to R and RStudio workshop availible online that will get you up to speed. The episodes up to and including “Subsetting Data” will get you where you need to be for this workshop.
Software Setup
Checklist
- For this workshop, we prepared a virtual image containing all the necessary software, packages and settings we will need. To clone this image into your machine, you first need to download and install Docker Desktop from this link. Make sure to choose the right version for your computer (Windows, Linux, MacOS Intel Chip or MacOS Apple Chip).
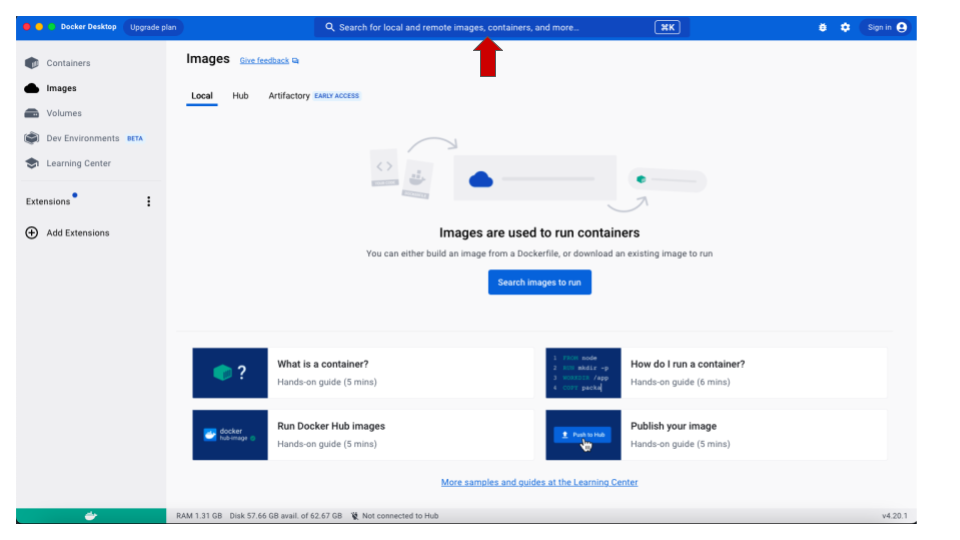
- Once installed, open Docker and use the search bar on the top to
look for iovercast/mess. This is where the image is
stored.
- Once the image is found (the name iovercast/mess
will show up in the drop-down list), you need to choose the processor
type for your computer. If you are using a M1/M2 MacBook, in the
tag drop-down menu, choose
mac-m1. For any other architecture (Windows, Linux and non-M1/M2 MacBooks), chooseintel. Then click onPull.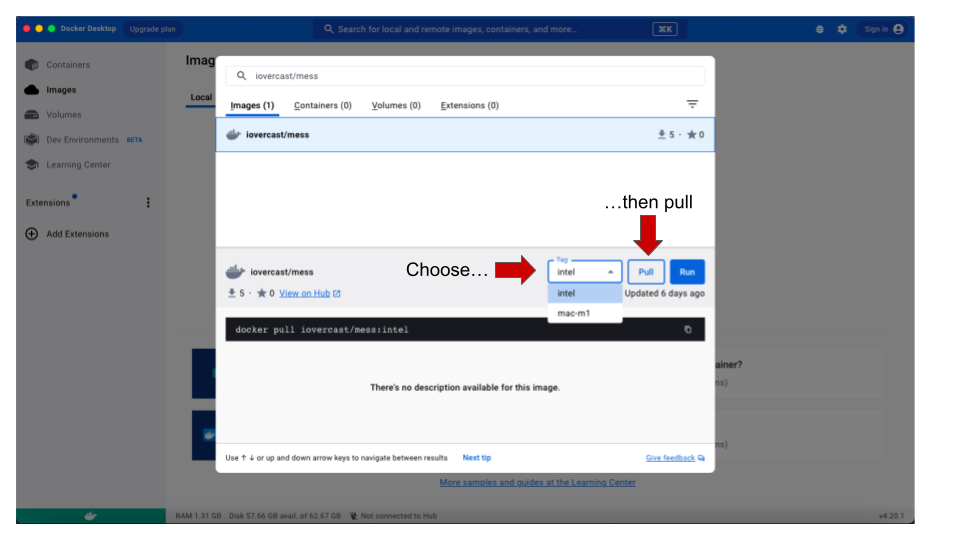
- Once the pull is done, click on the Images option
in the menu to the left. You should be able to see the new
iovercast/mess image listed there. To get it running,
click on the
Playicon under Actions.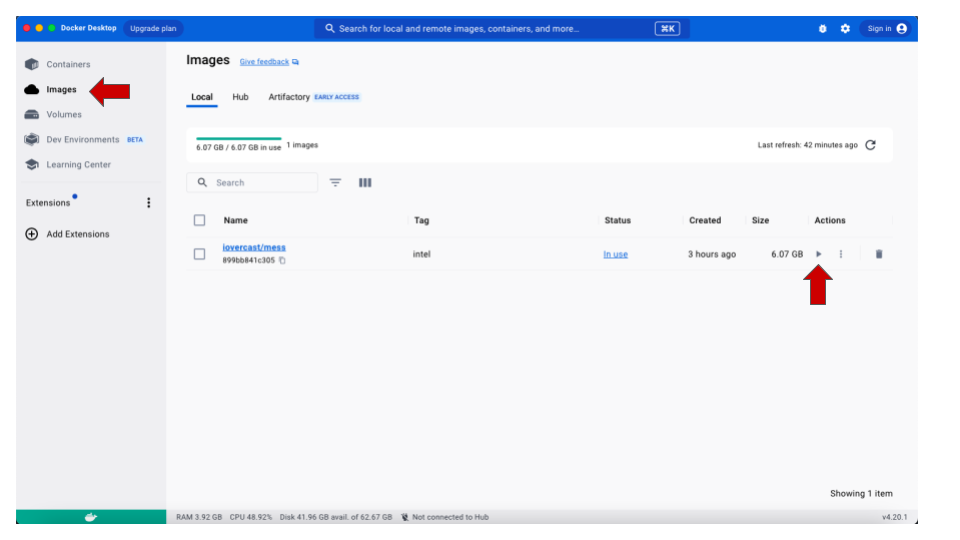
-
Make sure to add a port for the image. When
prompted for Optional settings, click on the arrow to open the drop-down
options and type 8787 in the
Host portoption. Then click on Run.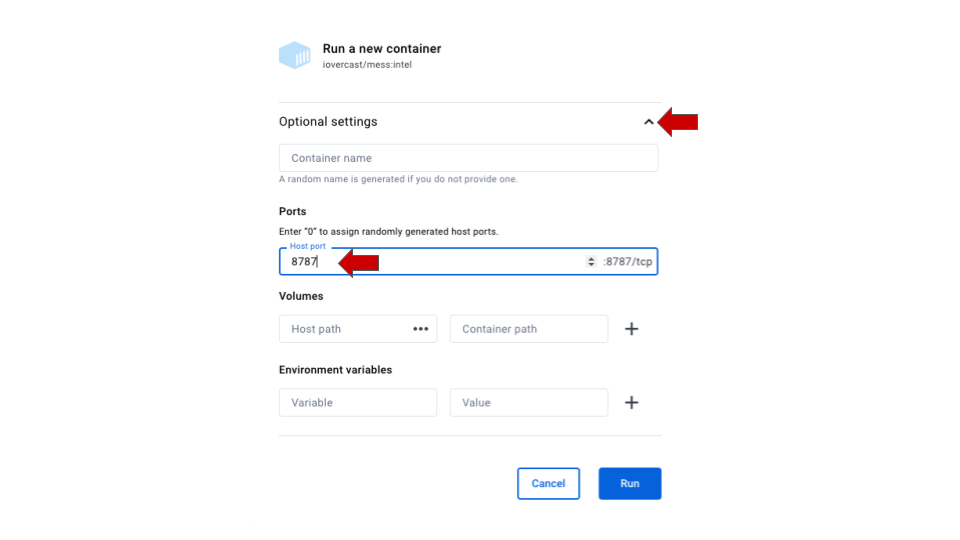
- In the new screen, click on the
8787:8787link below the image name.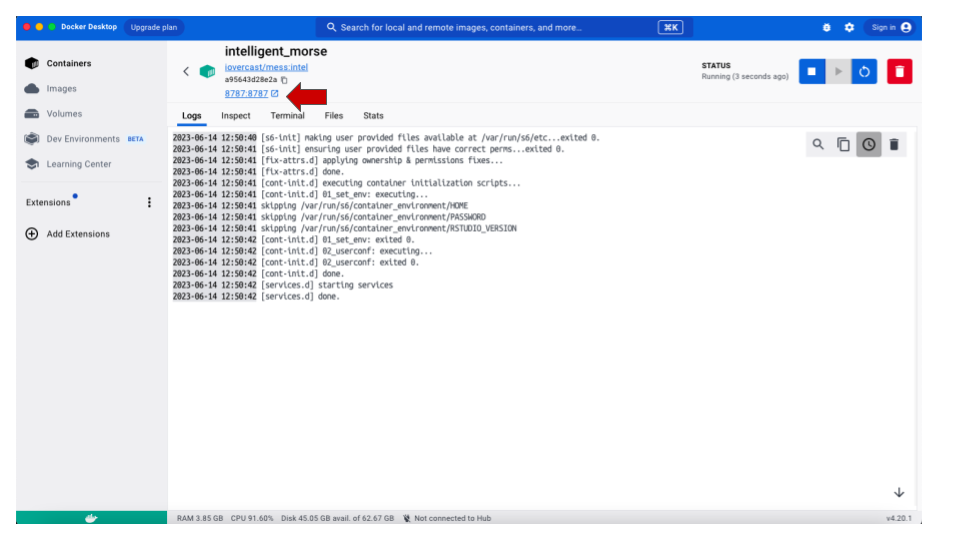
- A page for
rstudio-serverwill open on your internet browser, prompting you for the username and password. Typerstudiofor both username and password.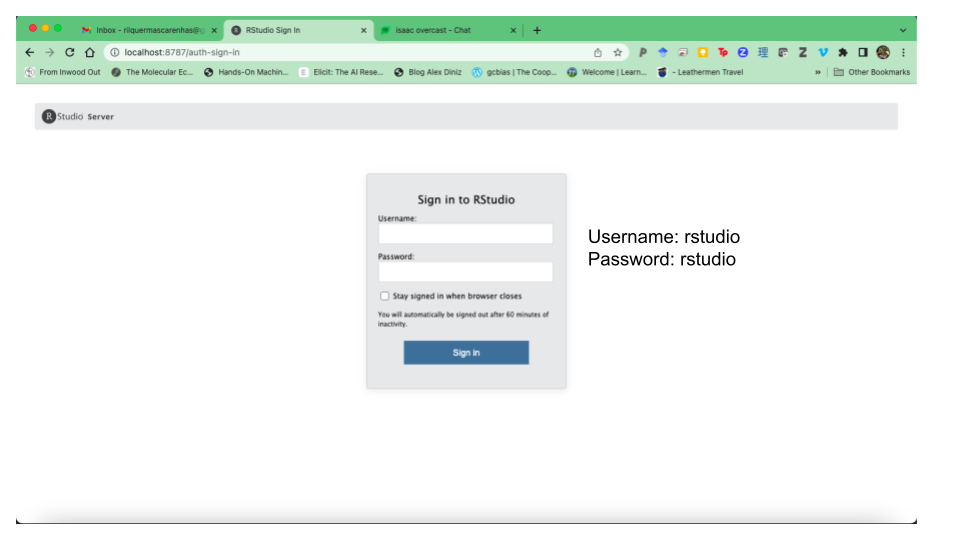
- If an RStudio screen opens on your brower, you are ready to start working.
