Introduction
Last updated on 2023-07-11 | Edit this page
Overview
Questions
- What do we mean by “multidimensional biodiversity data?
- What are the four types of data we’ll be covering in this workshop?
- What types of questions can we explore with these data?
- How will this workshop be structured? Where do I find course materials, etc?
Objectives
After following this episode, participants should be able to…
- Articulate a shared understanding of what “multidimensional biodiversity data” is
- List the types of data to be covered in this workshop, and potential applications of MBDB
- Locate course resources.
Welcome
Welcome everyone! This workshop will engage with ethics around biodiversity data through the lens of Indigenous data sovereignty and governance. With that in mind, many of the locations where this workshop might run will likely be unceded Indigenous lands. As part of our introductions we’ll think about where we are, where we come from, and our positionalities. Native Land Digital is a great resource for understanding where we are geographically, and here is a great video by Dr. Kat Gardner-Vandy and Daniella Scalice demonstrating classical academic introductions and relational introductions that center positionality:
Four dimensions of biodiversity data
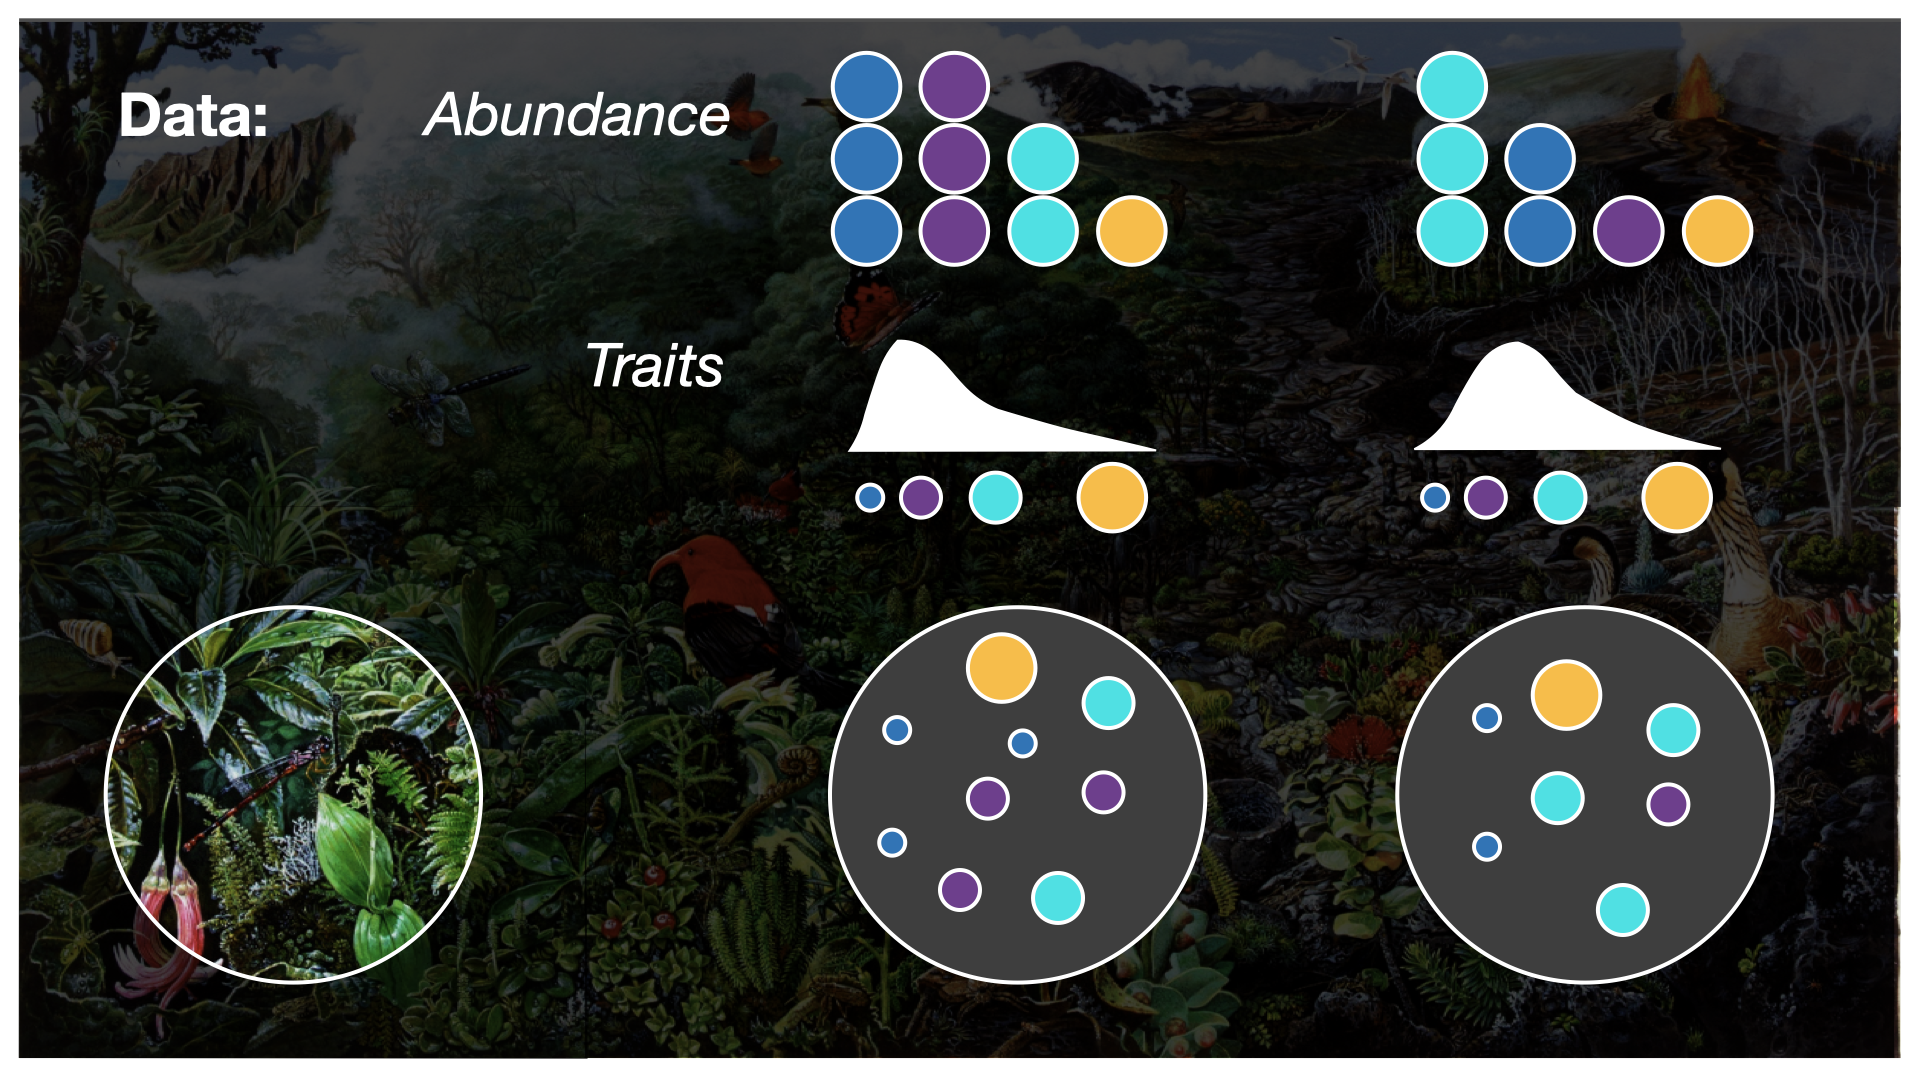
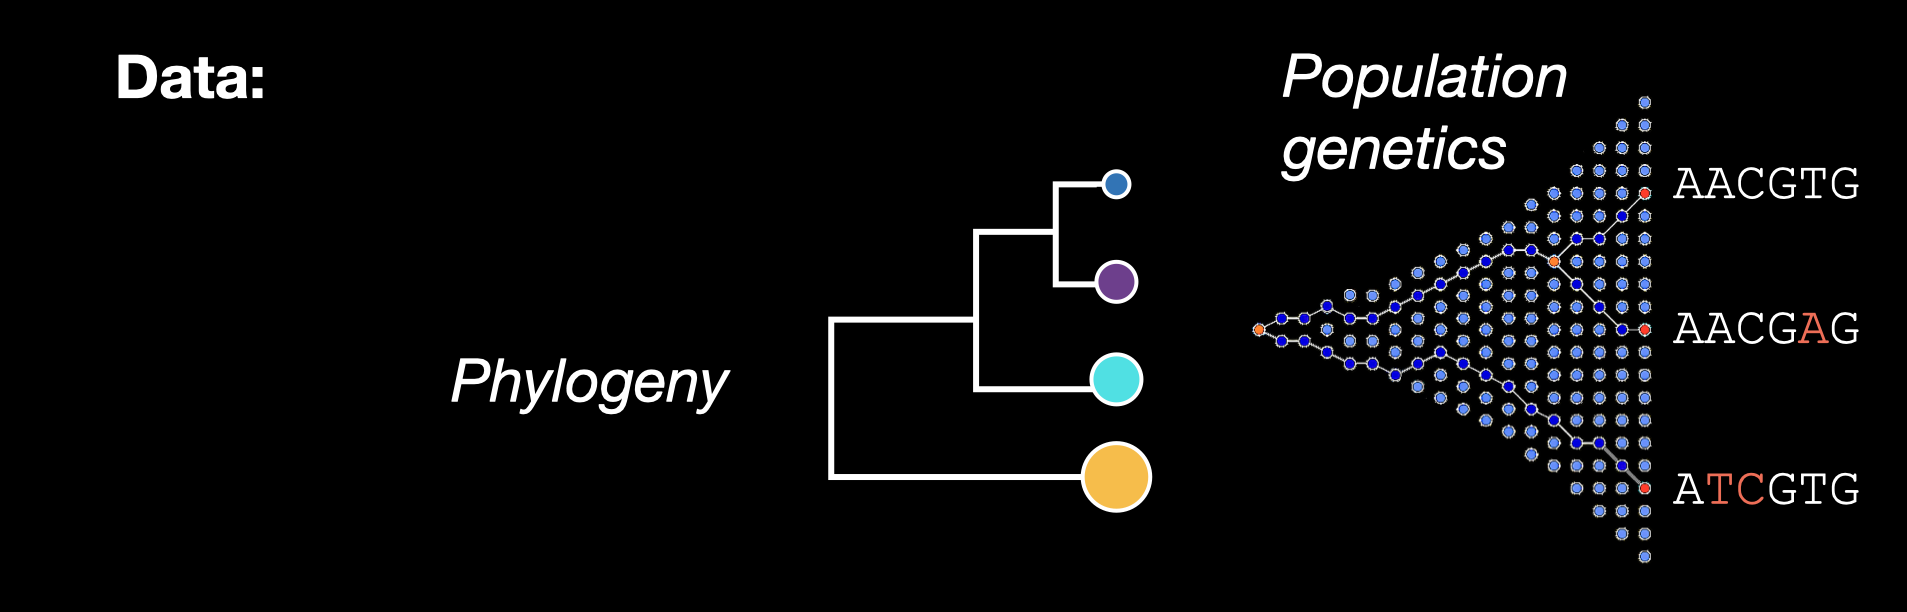
In this workshop, we’ll be working with four types of biodiversity data: species abundances, traits, population genetics, and phylogenetics. In this workshop, we’ll cover skills for working with each data type separately, and conclude with what we can accomplish when we integrate multiple data types into the same analysis.
To make this a little more interesting, we’ll ground our learning with a “real-world” (or, close to real-world) example!
For this workshop, we’ll be working with some simulated data based on real insect species found in the Hawaiian Islands The data contain real taxonomic names (so we can use workflows designed for dealing with real taxonomic data) but the abundances, traits, genetics, and phylogeny are simulated using a process model (more on that in Part II of this workshop).
Hawaiian sovereignty
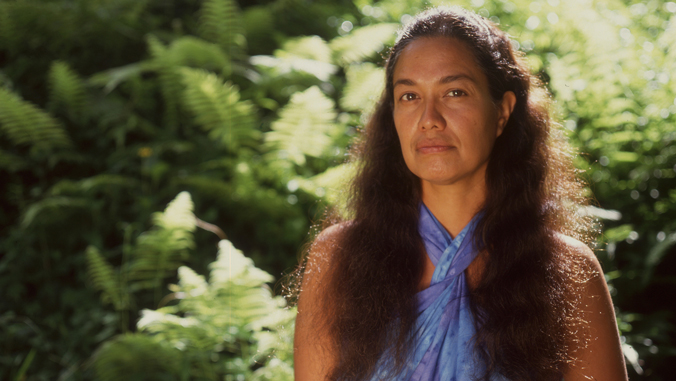
Building from our acknowledgement of the Indigenous land where we gather for this workshop, we need to acknowledge that over a century of settler research has been conducted across the Hawaiian Islands without the consent of the Kanaka Maoli, the Native Hawaiians. The aina, or lands, of the Kanaka Maoli were stolen, their sovereignty illegally stripped, their culture, communities, and bodies killed. Sovereignty and the return of control of data to Indigenous people and communities is one of the learning objectives of this workshop. To start us on that journey, here are the words (watch on youtube) of Dr. Haunani-Kay Trask, a leader in the Hawaiian sovereignty movement:
We are not Americans! We will die as Hawaiians! We will never be Americans! I am here to explain what sovereignty is. Sovereignty, as many people say, is a feeling. The other day in the paper I read sovereignty is aloha, it’s love. Later on someone said it’s pride. No. Sovereignty is government. Sovereignty is government! It is an attribute of nationhood. We already have aloha. We already have pride. We already know who we are. Are we sovereign? No! Because we don’t have a government. Because we don’t control a land base. Sovereignty is not a feeling, it is the power of government. It is political power!
One of the contributions we as researchers can make to rematriation and repatriation of resources is to cede control of legacy biological data back to Indigenous communities, and preferably to engage in co-produced research from the beginning, where consent, governance, and mutual benefit are agreed upon before research begins. In Episode 3: CARE and FAIR principles, we will be learning about protocols developed by ENRICH and Local Contexts that center Indigenous data sovereignty and governance.
More about our simulated data
The Hawaiian Islands formed over a volcanic hotspot, as such Kauai is about 5 million years old, while the Big Island is still forming.
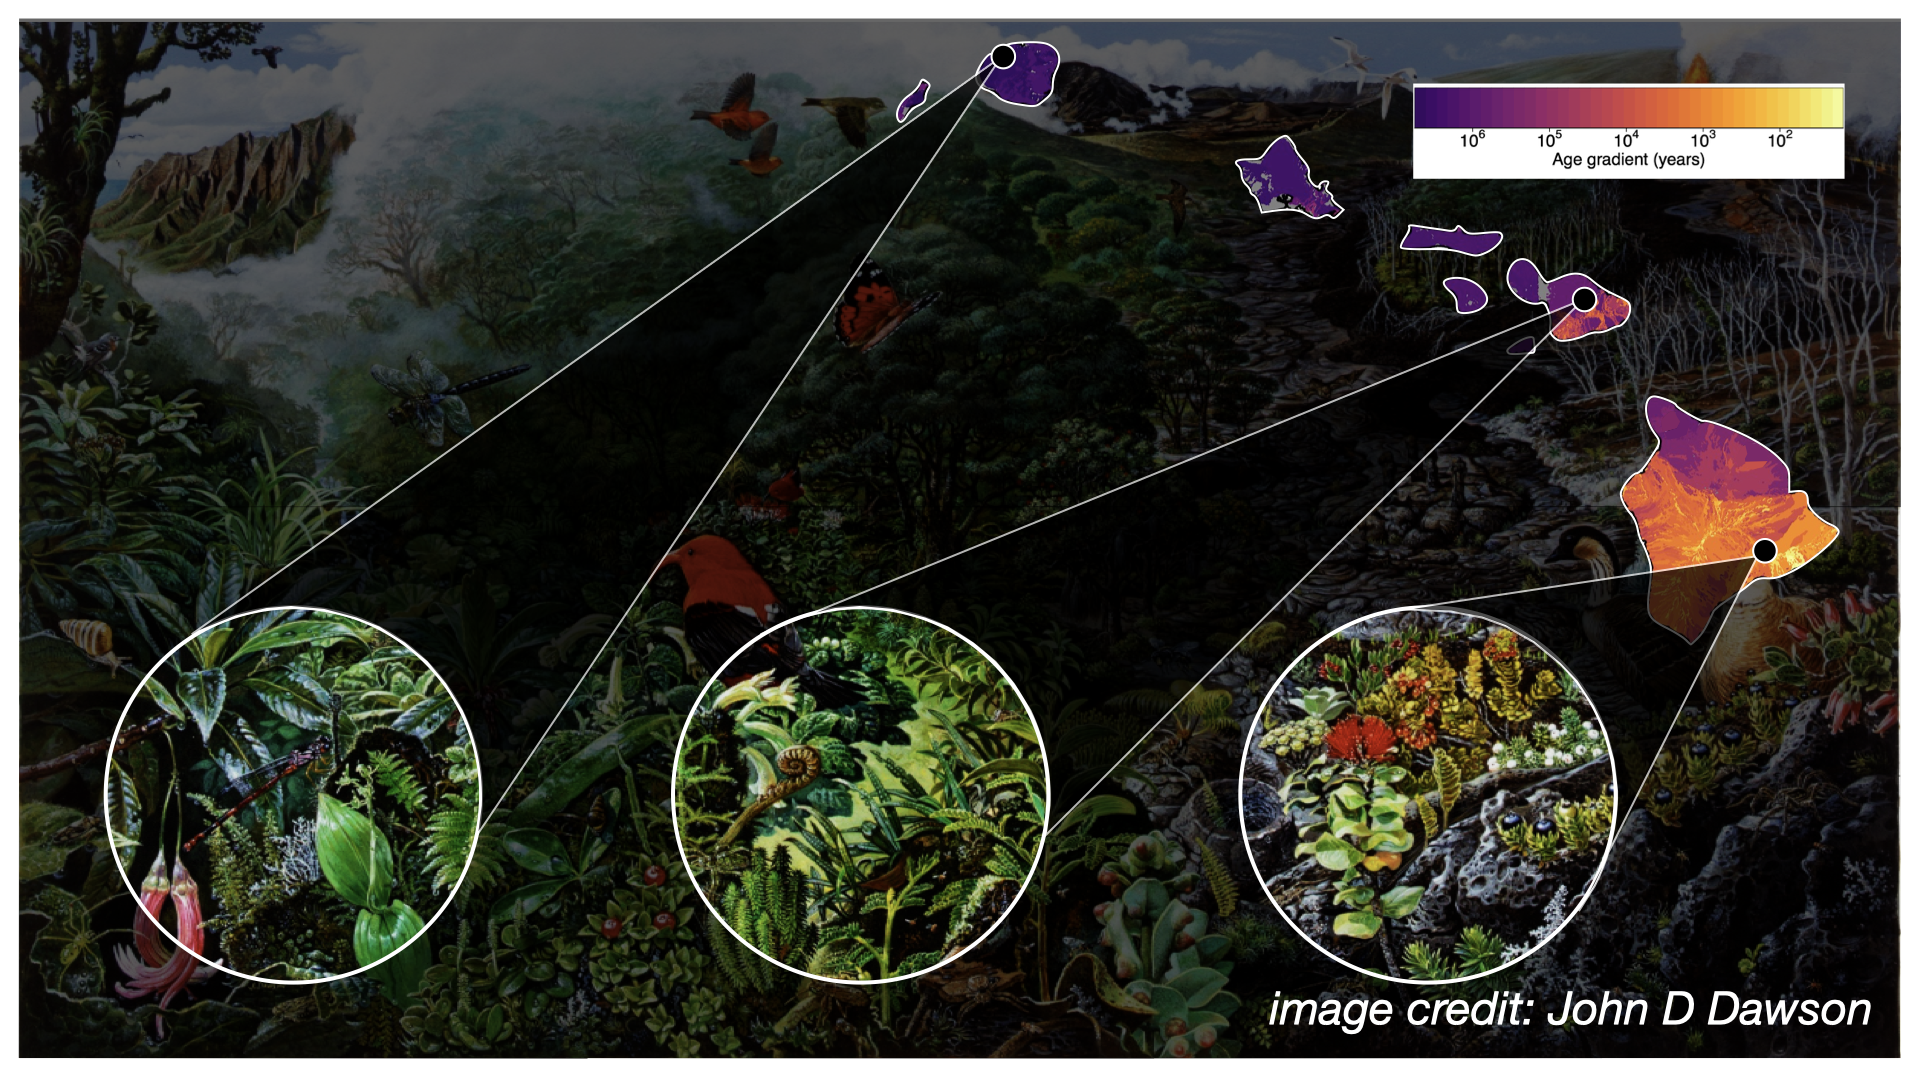
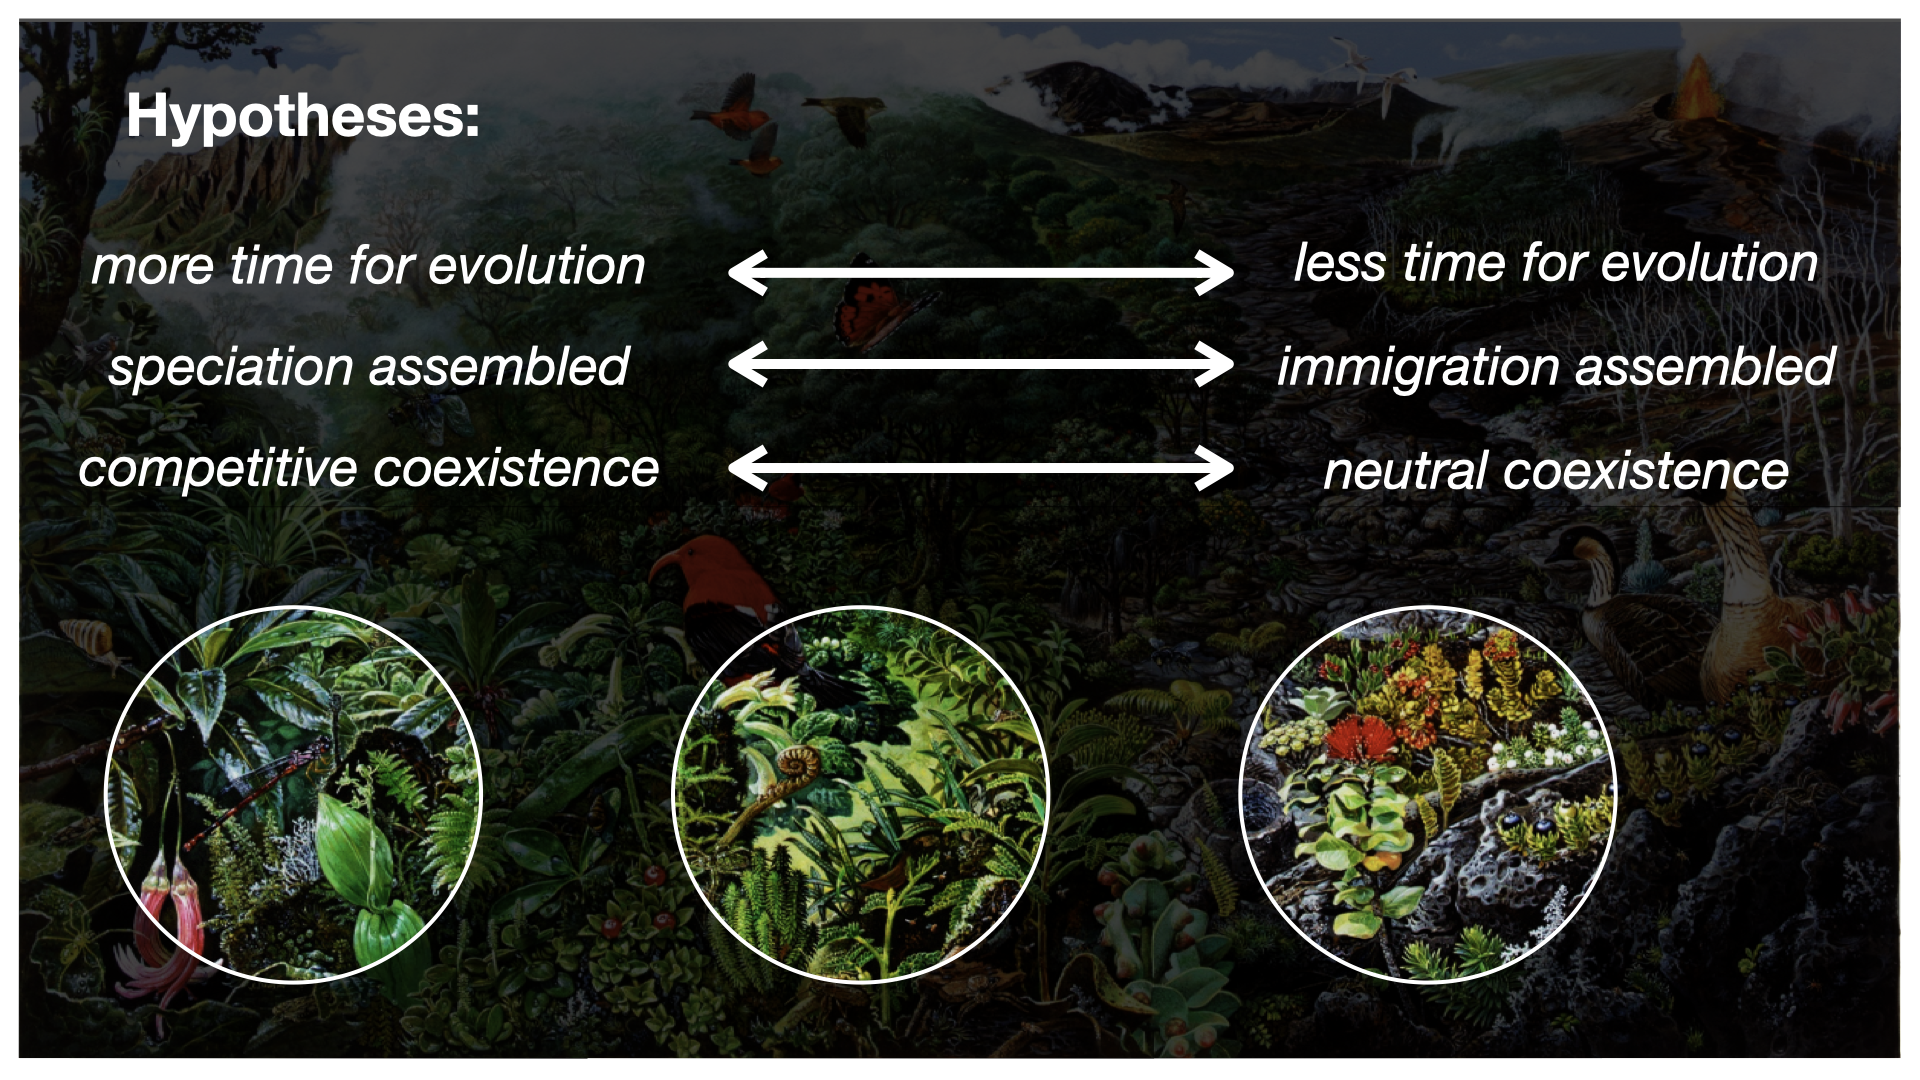
This chronosequence allows us to observe in the Modern (as opposed to the fossil record) what we might hypothesize to be different eco-evolutionary stages, or “snapshots,” of community assembly. We might further hypothesize that different assembly processes are more or less prevalent at different snapshots, such as increased importance of immigration early on, and greater importance of in situ diversification later on.
How are the four dimensions of biodiversity data conceptualized?
Workshop logistics and preview
For the rest of the workshop, we’ll take a tour of the data types and then bring them together.
Helpful links
Course website: https://role-model.github.io/multidim-biodiv-data/